Introduction
The goal of an insulation coordination study is to select the appropriate insulation levels for electrical equipment to withstand overvoltages, which may be caused, for example, by lightning and switching. These studies are guided by international standards such as IEC 60071 and IEEE Std 1313.2, which provide guidelines for evaluating the necessary insulation levels.
This toolbox facilitates the implementation of these standards, ensuring that engineers meet international compliance requirements.
Why Insulation Coordination studies must be performed?
Insulation coordination studies evaluate the reliability of equipment against overvoltages. This is vital for avoiding costly interruptions and equipment damage, extending the lifespan of electrical assets, and ensuring operational safety.
What are the challenges in performing an Insulation Coordination ?
- Understanding and applying standards can be challenging due to their technicaldepth and the numerous parameters involved. Analyzing the results from thesimulations can be difficult without a clear understanding of the data. Therefore,ensuring compliance with standards requires expertise.
- Insulation coordination requires complex statistical analysis, especially forswitching operations, where random closing times must be simulated. This canbe time-consuming and difficult without the right tools.
- Accurately modeling devices, such as surge arresters, voltage probes or otherequipment, requires careful attention, as it can lead to inaccuracies if not doneproperly.
- Lightning parameters are complex to calculate and the number of simulationsto perform to find the probability of failure (also called Mean Time BetweenFailure (MTBF)) due to lightning is high.
Advantages of the Toolbox
- This toolbox is a powerful asset, automating the interpretation of complex standards.It simplifies insulation coordination studies, allowing even non-experts to achieve accurate, compliant results by automatically interpreting simulation results and reducing the need for technical expertise.
- The toolbox includes models of:
Frequency dependent surge arresters: This device automatically adjusts theparameters of the frequency-dependent zinc oxide (ZnO) model, as specified bythe IEEE Working Group 3.4.11.
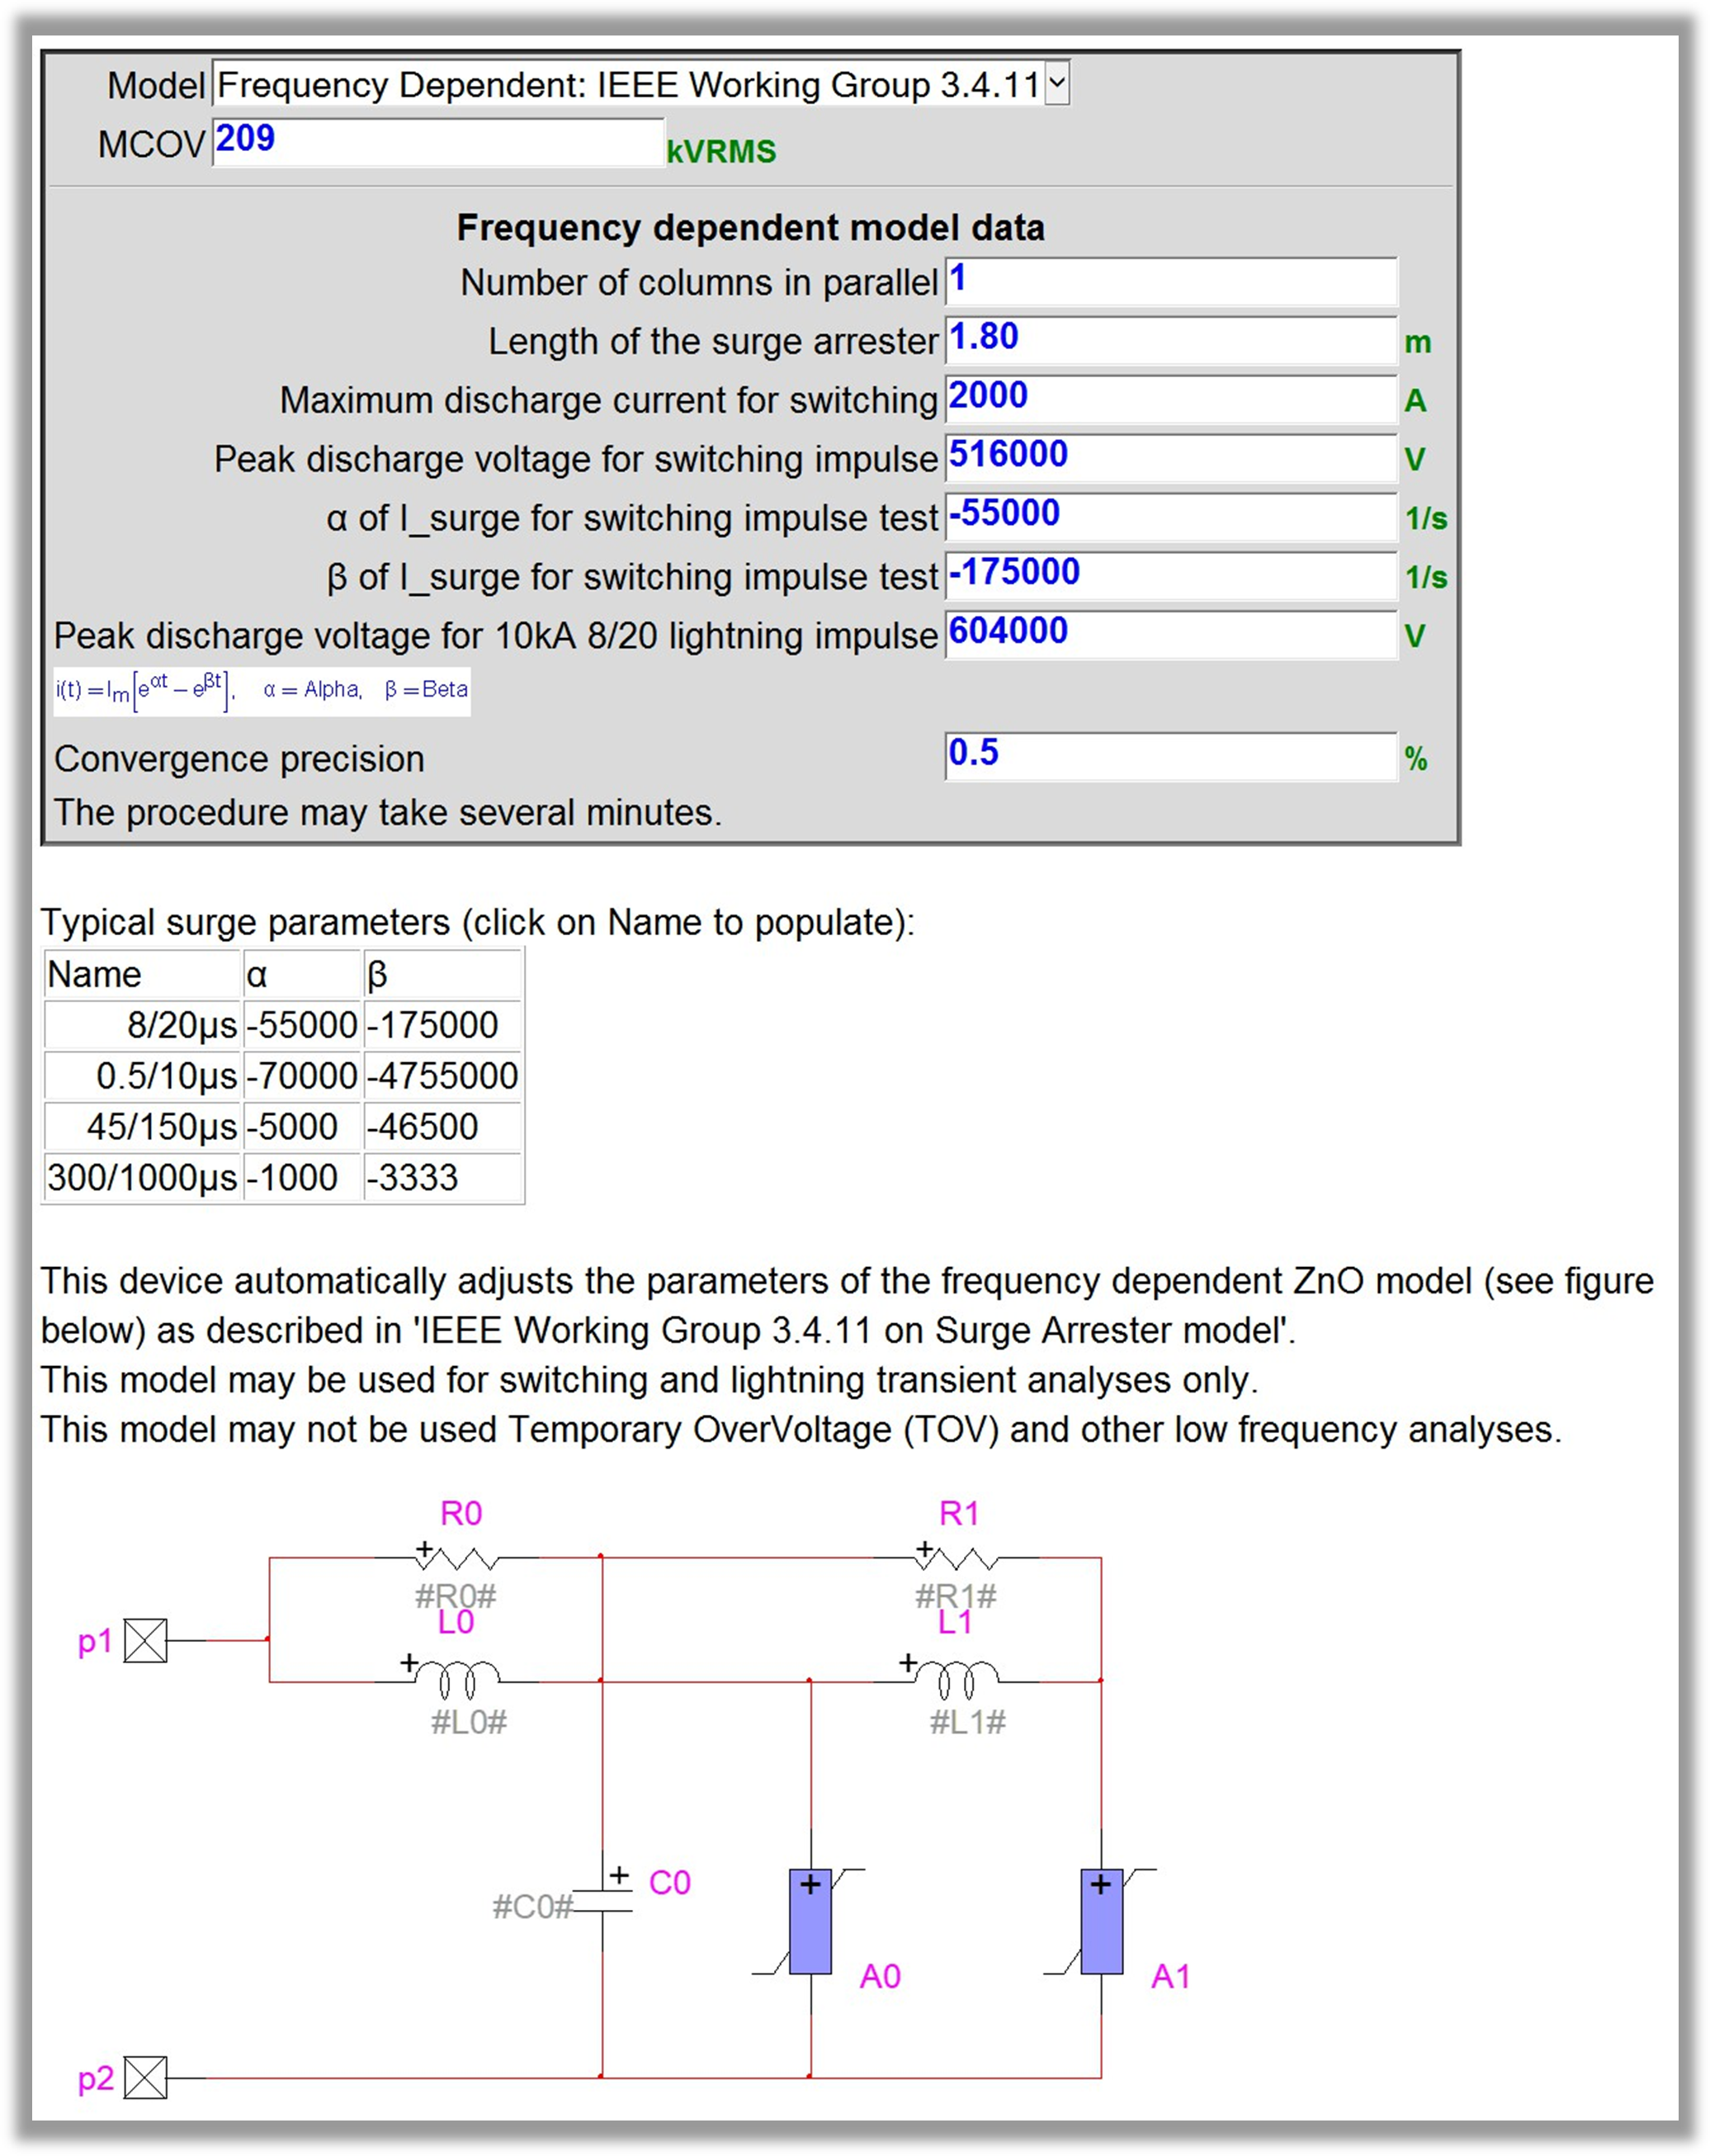
Figure 1: Mask of the surge arrester model available with the toolbox voltage probes: This device contains insulator characteristics based on the type of insulation, either internal or external. It is placed at the terminals of equipment where the insulation coordination analysis is performed.
Standard and typical values of BSL, BIL and CFO are available.
Users can provide critical information for the insulation coordination procedures, such as if the device is protected by surge arrester.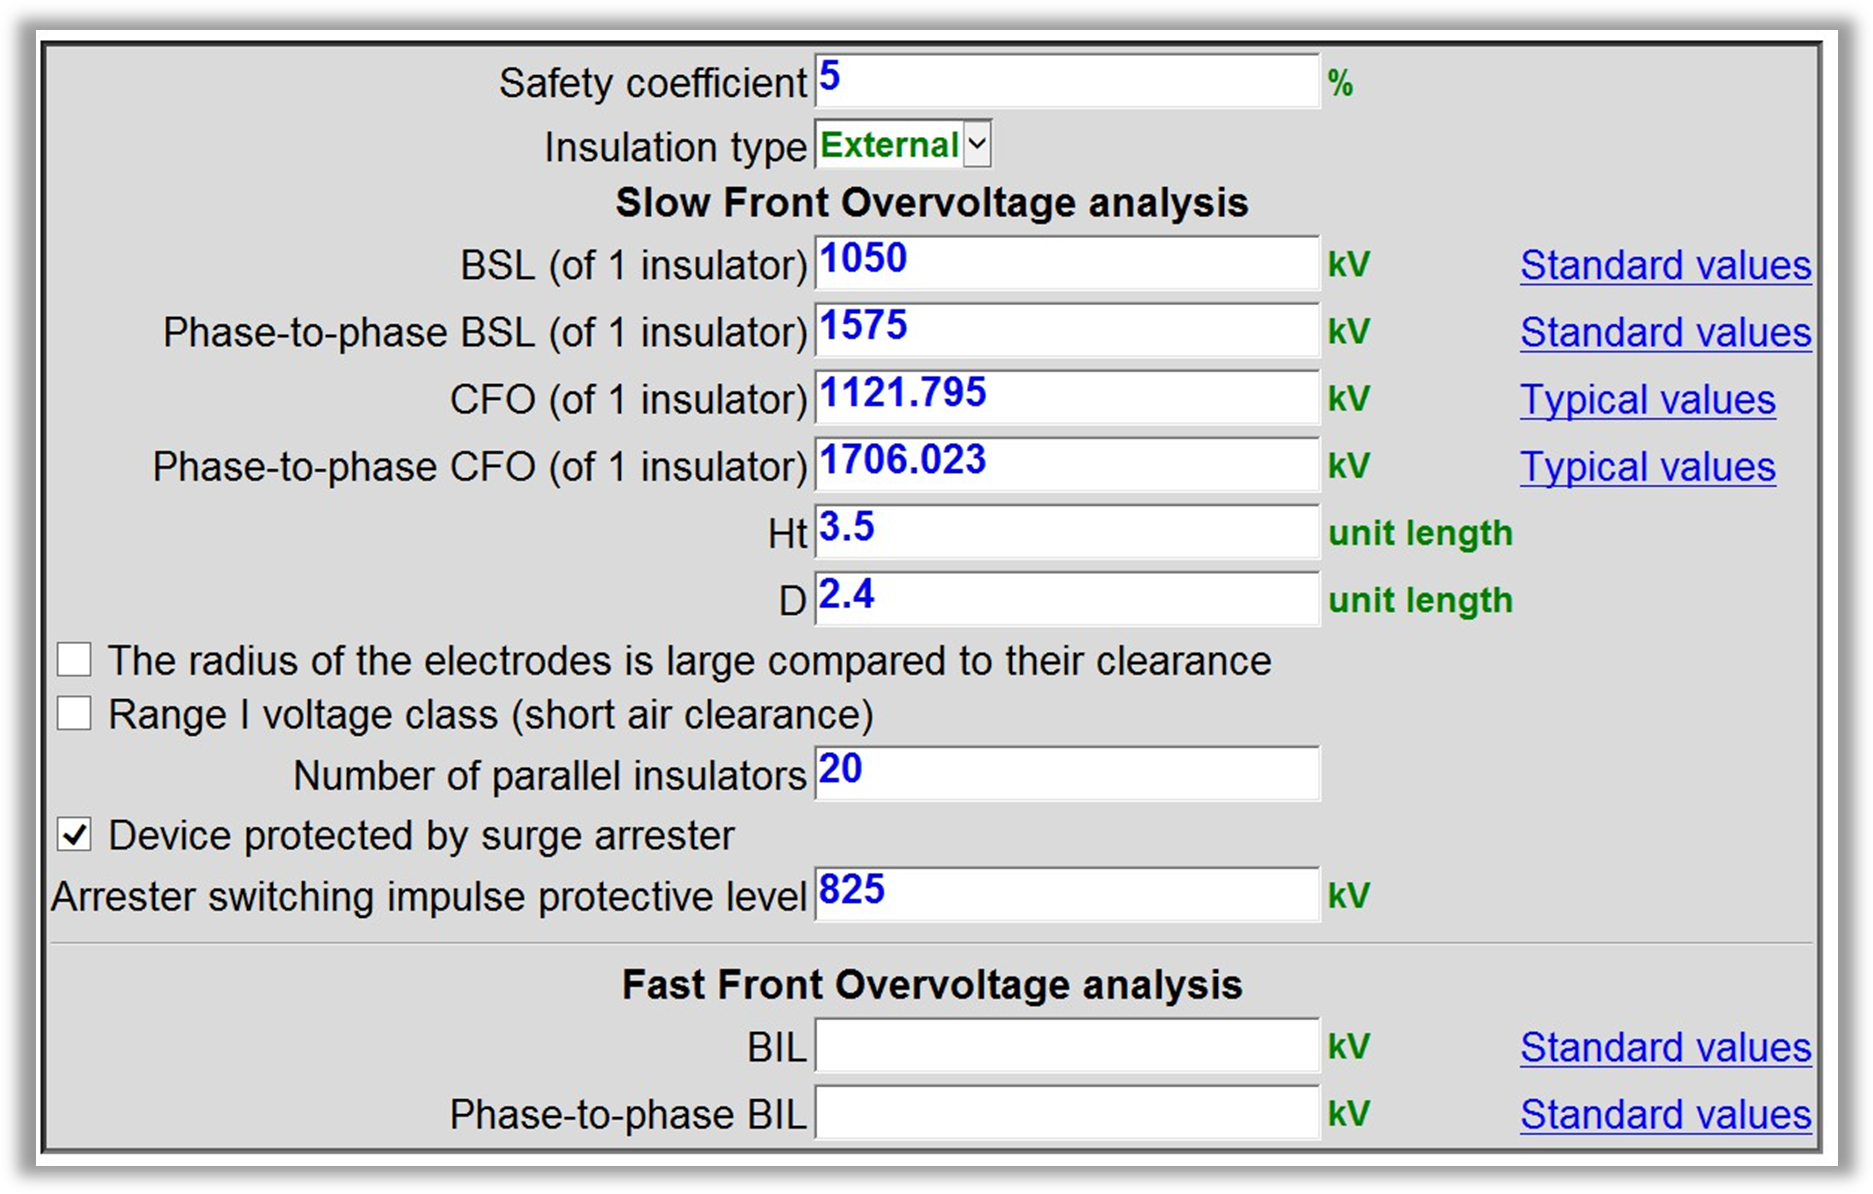
Figure 2: Mask of the voltage probe available with the toolbox
For switching transients:
- The toolbox automates the analysis of the statistical overvoltage distribution obtained by EMTP. This distribution is obtained using the statistical feature of EMTP, which varies the breaker switching time following uniform and Gaussian(Normal) distributions, as recommended in insulation coordination guidelines.
- Representative over-voltages such as maximum statistical voltage (UT), E2,which is the overvoltage value with a 2% chance of being exceeded, and the standard deviation of the statistical overvoltage distribution.
Basic Switching Levels (BSL) and Critical Flashover voltage (CFO) are verified, and the flashover rate is derived.
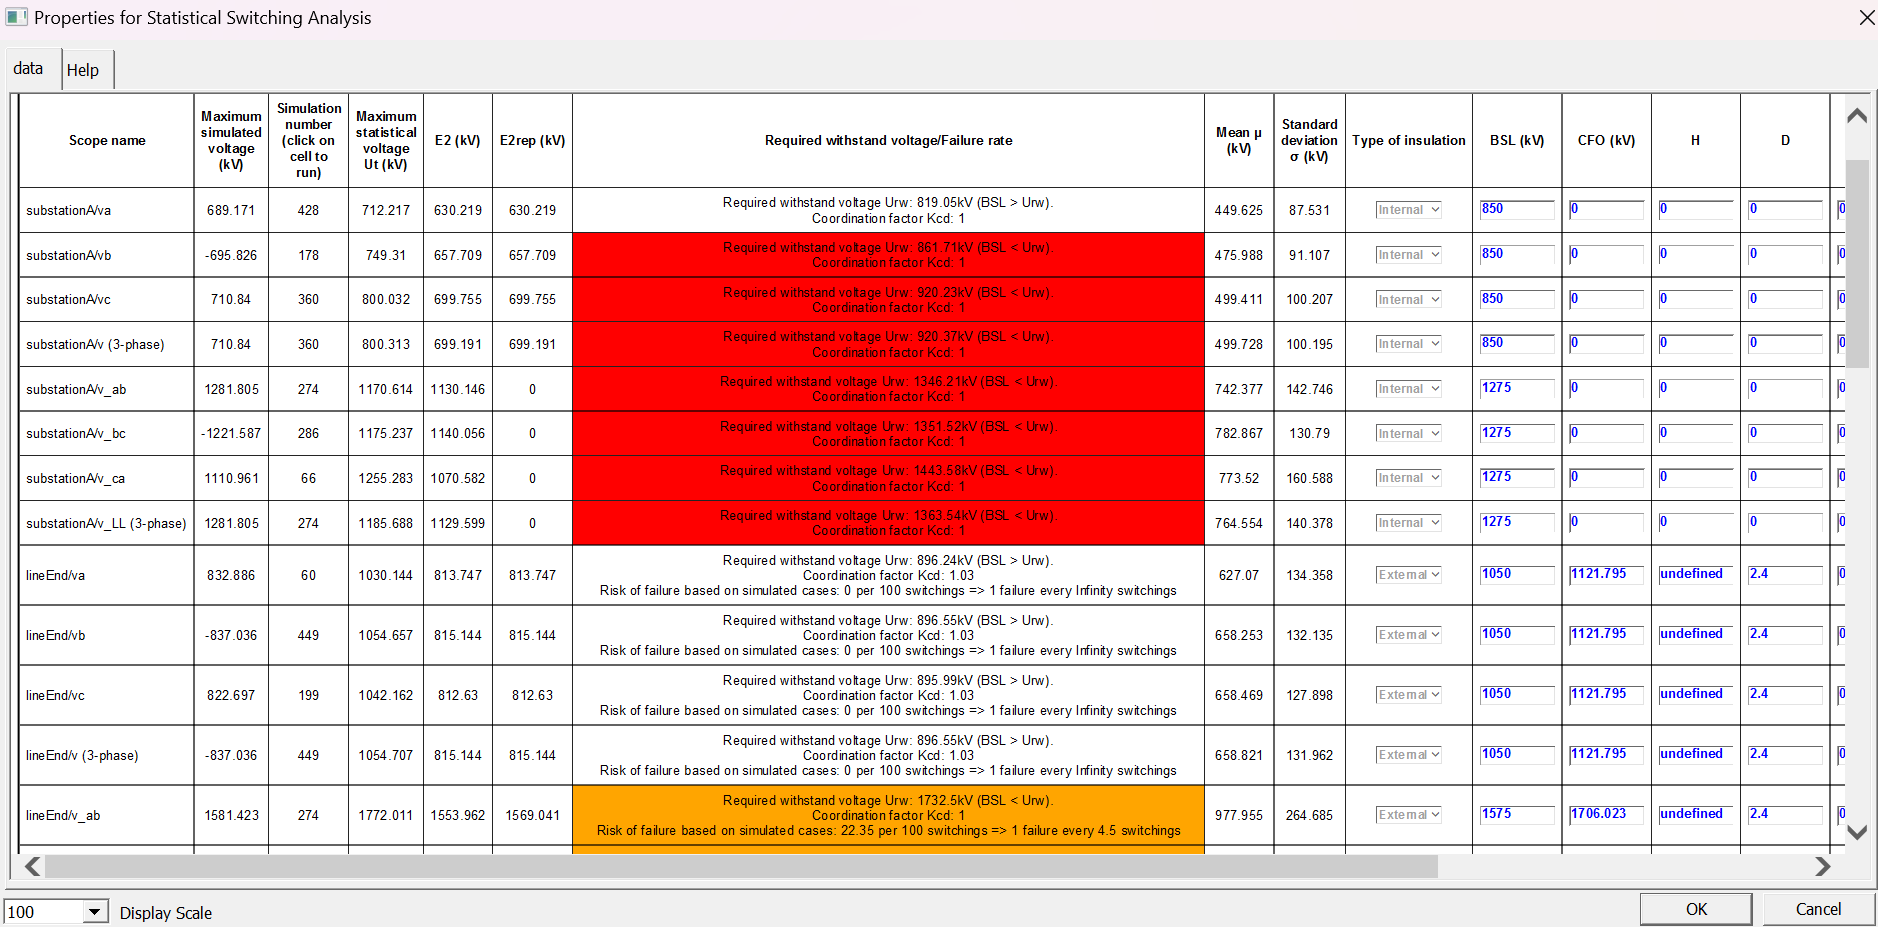
Figure 3: switching transient analysis report produced automatically. Capacitor bank and line switching examples are provided.
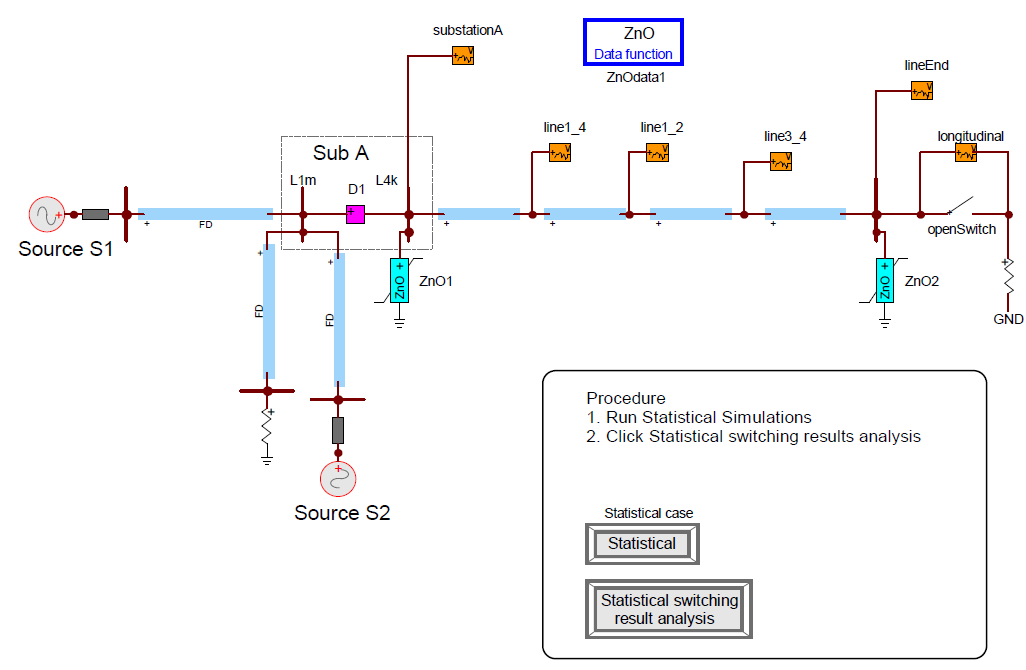
Figure 4: Example of a line switching example
For lightning transients:
Lightning Stroke Device: This model is based on the CIGRE lightning stroke wave shape, represented as a current source in parallel with a resistance. It simulates lightning strikes and helps post-process the results. It provides:
- Attractive radiuses of wires
- Probabilities of having a lightning stroke striking a line
- The attractive zone area over a section of line
- The number of lightning strokes reaching this section of the line annually
- The annual number of back flashover events creating a failure
- The mean time between failures at the probes due to this line section
- The maximum shielding current
- The shielding failure rate (SFR)
- The shielding failure flashover rate (SSFOR)
Critical lightning currents for flashover determination and mean-time-between-failure (MTBF) analysis.
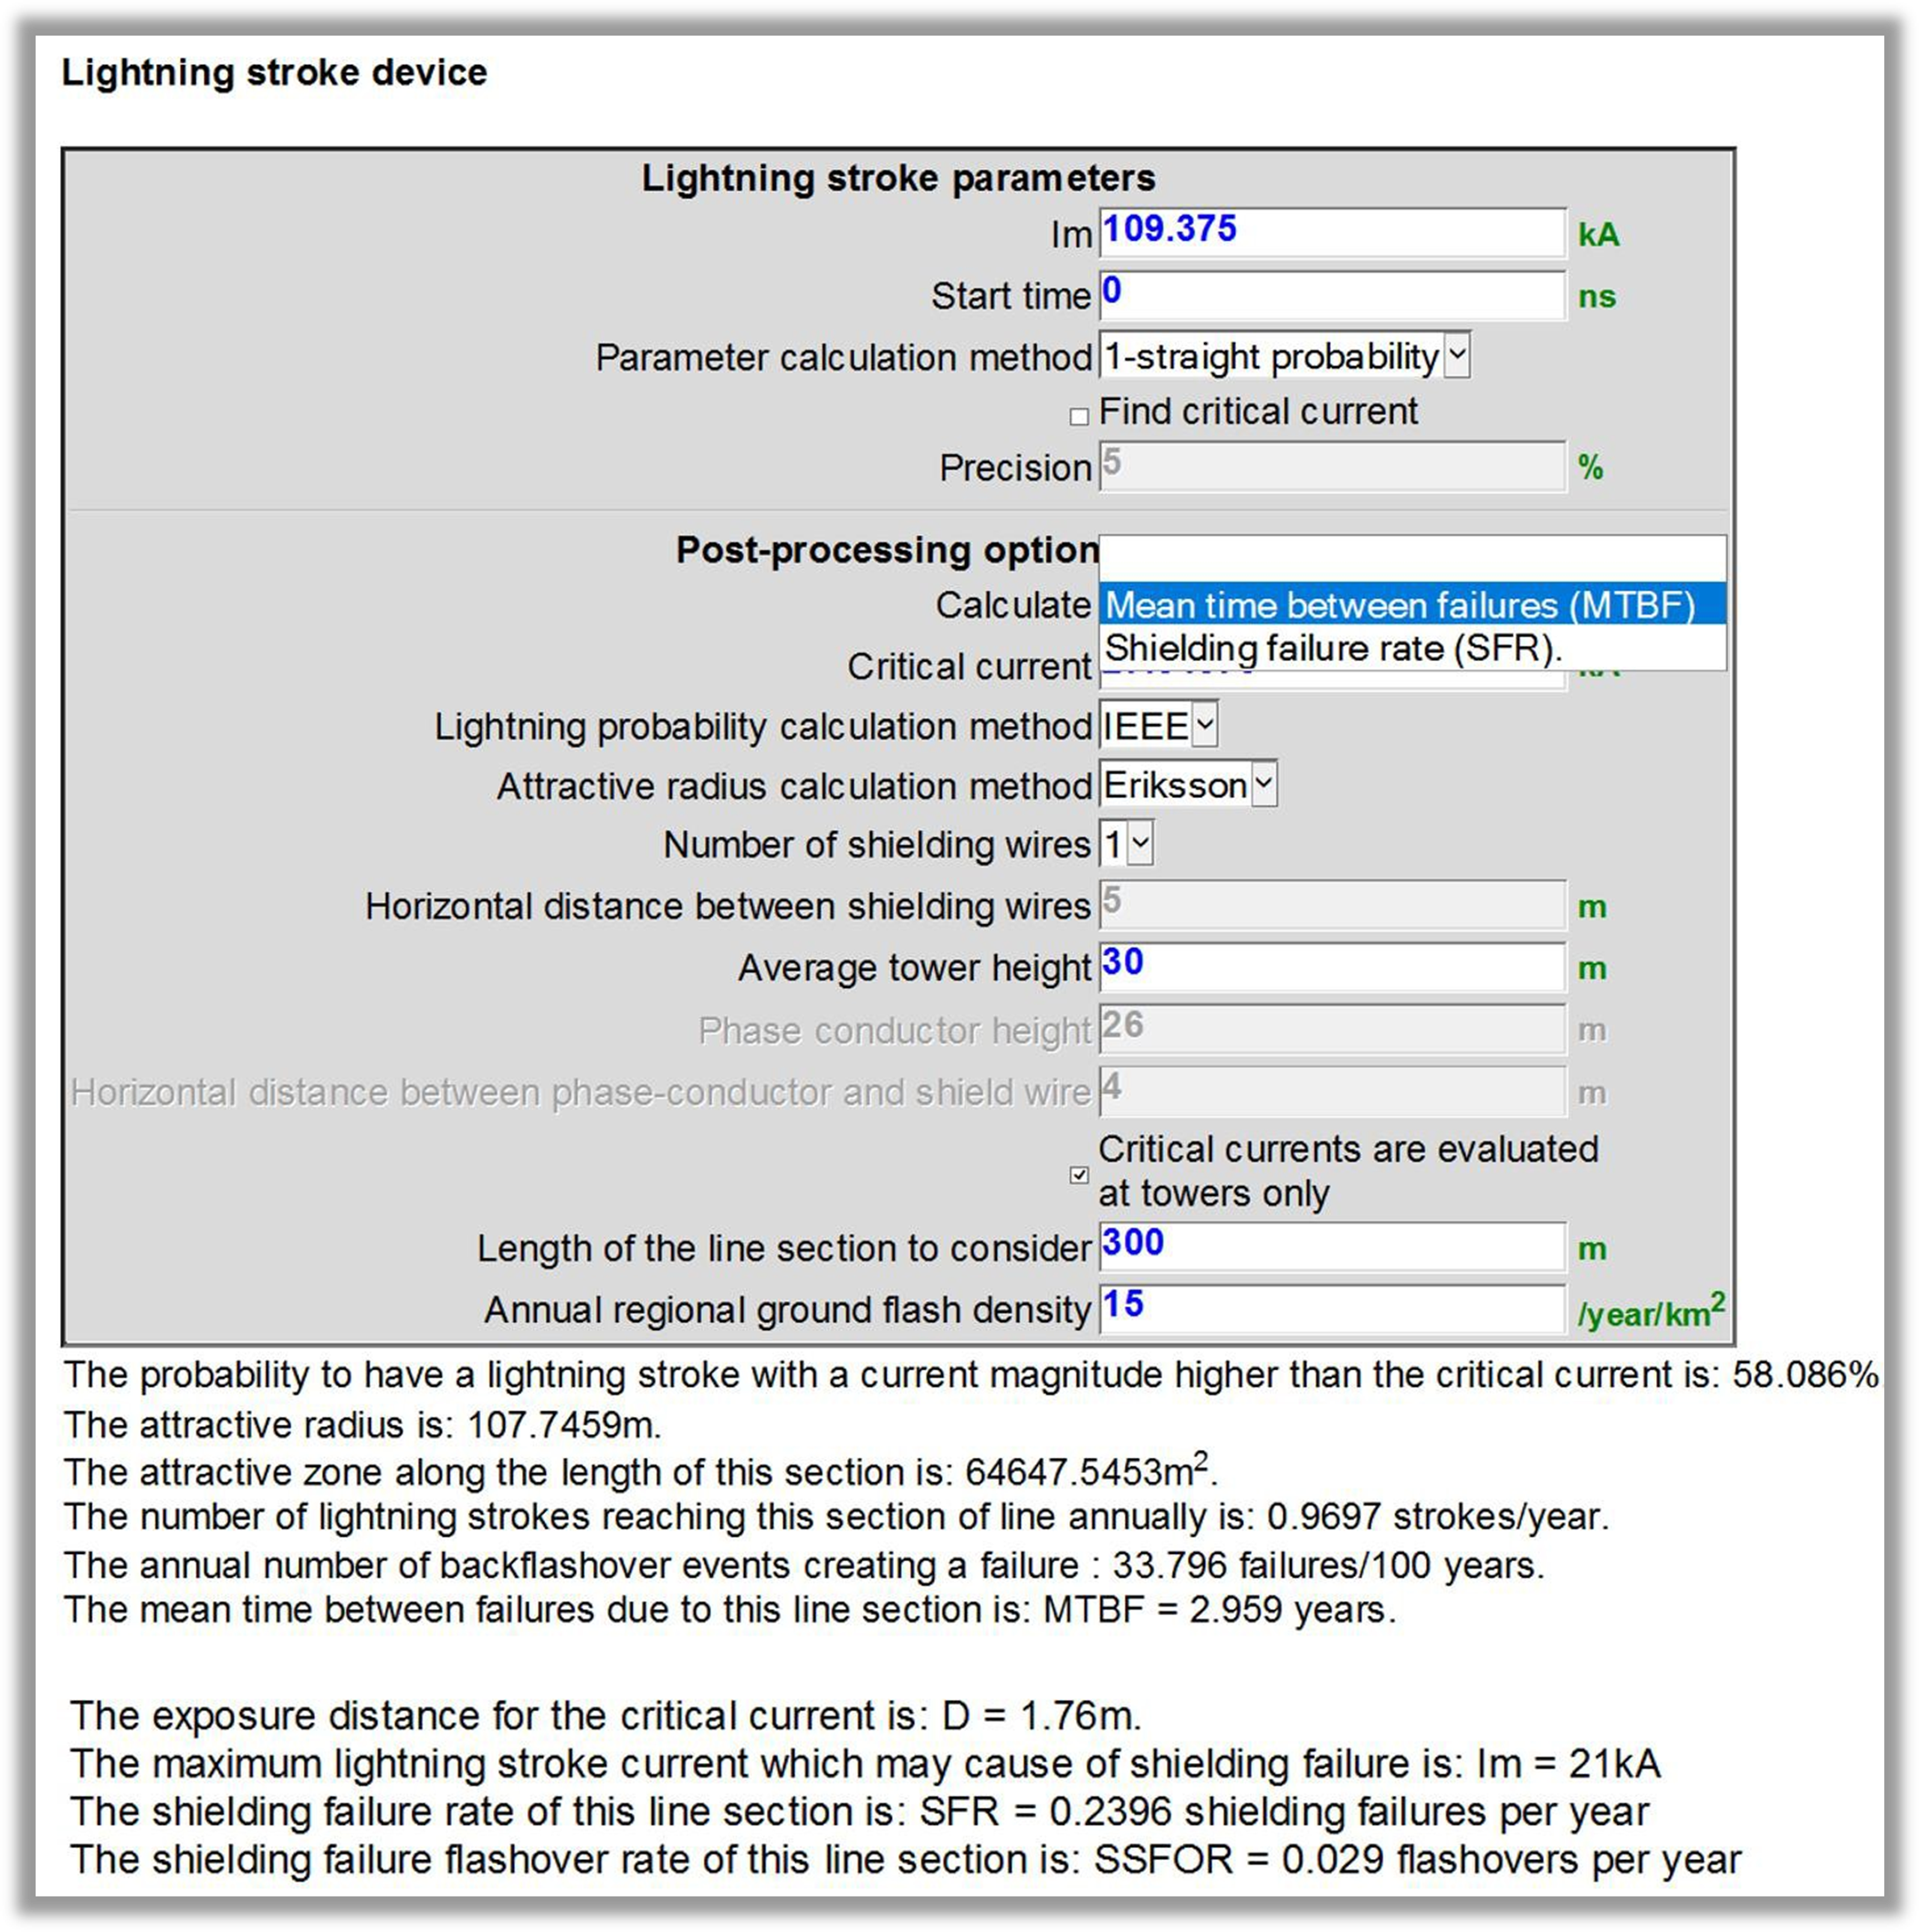
Figure 5: Lightning stroke device mask A lightning example is provided.
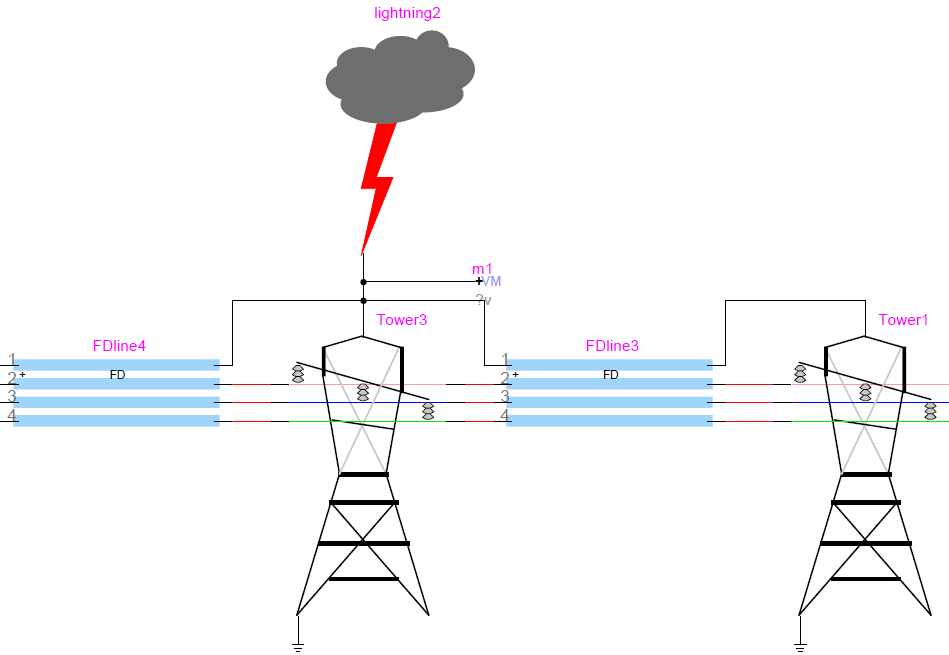
Figure 6: example of a lightning stroke device connected to a shielding wire.